
What is Fishbone diagram?
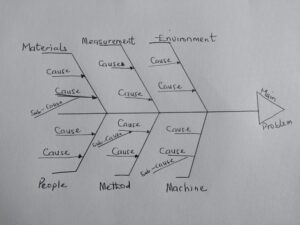
A Fishbone diagram is a visualization tool for categorizing the potential causes of a problem to identify its root causes.
Developed by Kaoru Ishikawa in the 1960s as part of quality management processes. It resembles a fish skeleton, with the main problem at the head and potential causes branching off as bones.
How to create a Fishbone Diagram
Identify the Problem: Clearly define the problem and write it at the head of the fish.
Determine Major Categories: Identify major categories that might be causing the problem.
Common categories include: i. people; ii. methods; iii. machines; iv. materials; v. Measurements; and v. environment.
Brainstorm Possible Causes: For each category, brainstorm possible causes and write them as smaller bones off the main bones.
Analyze and Identify Root Causes: Evaluate the diagram to identify which causes are most likely contributing to the problem.
Practical Applications of Fishbone Diagram
Quality Control: Used extensively in manufacturing and production to identify quality defects.
Healthcare: Helps in identifying the causes of medical errors and improving patient safety.
Project Management: Assists in troubleshooting project delays and inefficiencies.
Case Study: Improving Product Quality in a Manufacturing Company
The Issue: A manufacturing company noticed an increase in the number of defective products being produced on one of their assembly lines. The defects were causing customer complaints, increased returns, and additional costs due to rework. The company decided to use a fishbone diagram to identify the root causes of the defects and implement corrective actions
Main cause
The team defined the main cause as: Increase in Defective Products.
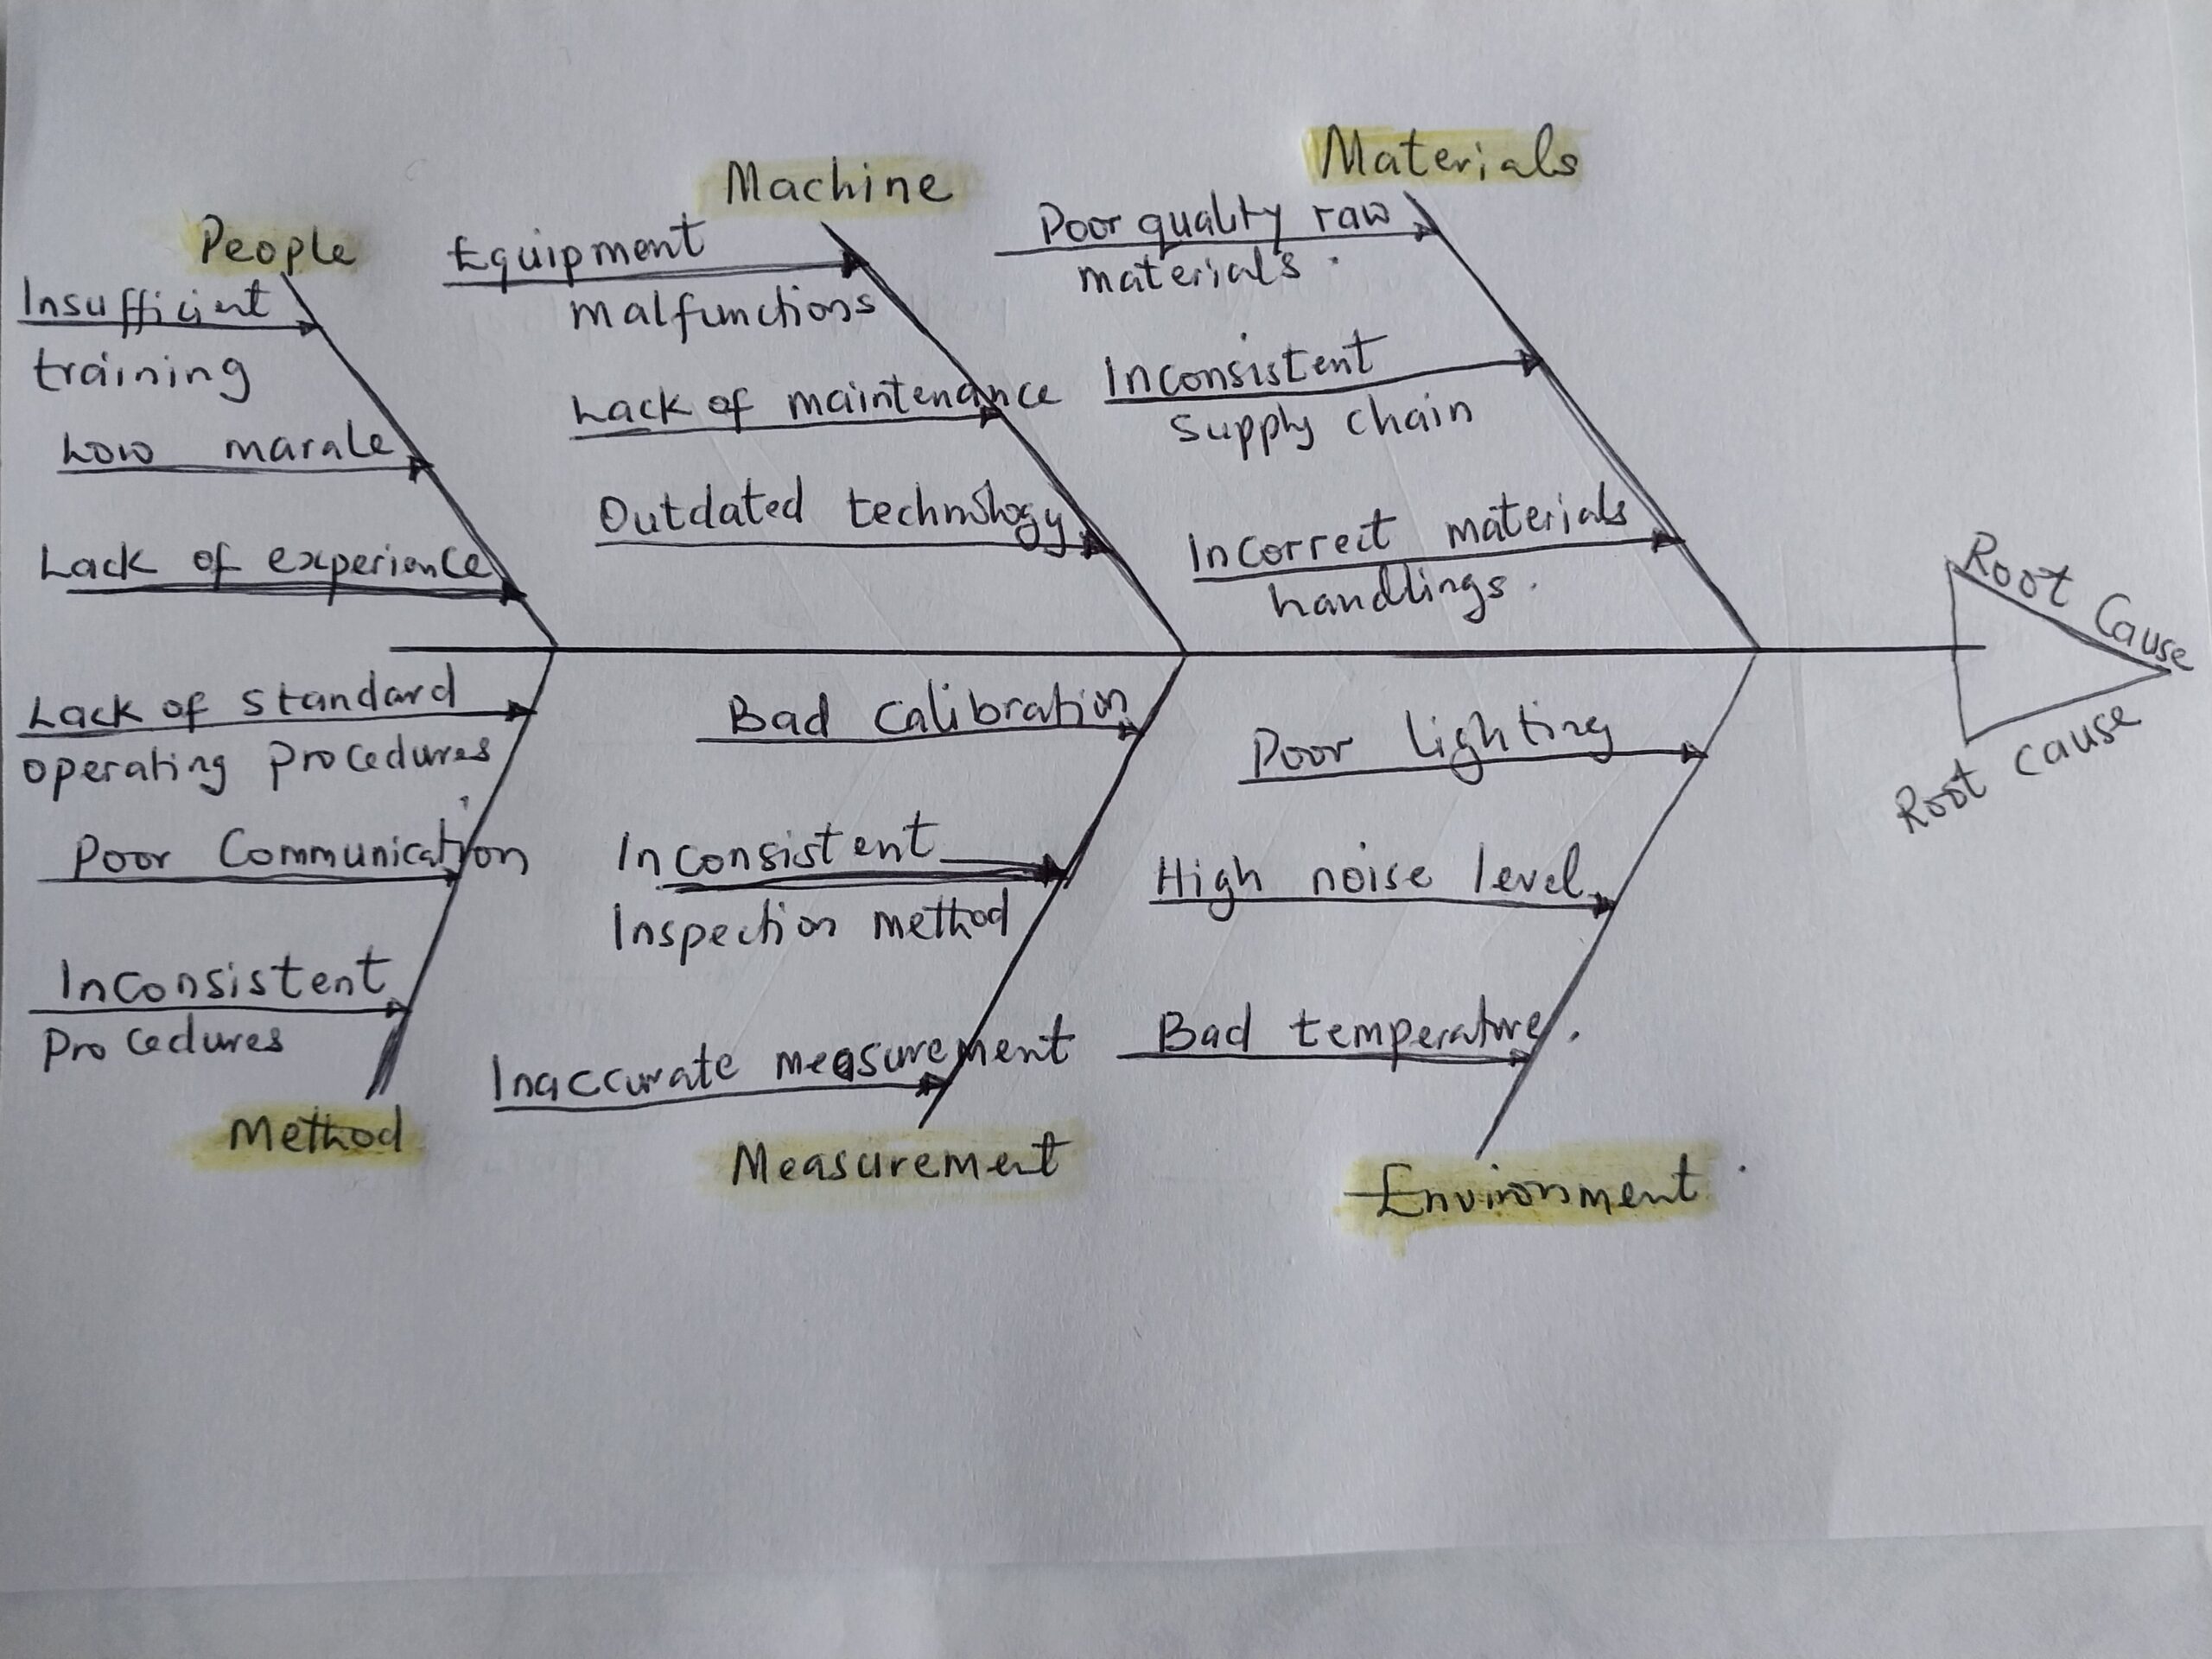
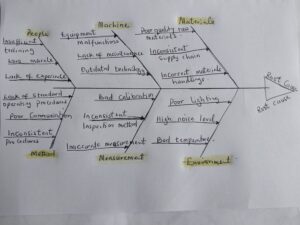
Fishbone diagram of the defect
People:
i. Insufficient training ii. Lack of experience iii. Low morale
Methods:
i. Inconsistent procedures ii. Lack of standard operating procedures (SOPs) iii. Poor communication of process changes
Machines:
i. Equipment malfunctions ii. Lack of maintenance iii. Outdated technology
Materials:
i. Poor quality raw materials ii. Inconsistent supply chain iii. Incorrect material handling
Measurements:
i. Inaccurate measurement tools ii. Lack of regular calibration iii. Inconsistent inspection methods
Environment:
i. Poor lighting ii. High noise levels iii. Uncontrolled temperature and humidity
Outcomes Achieved after Fish Bone diagram analysis
- Quality Training
- Standardized Procedures
- Equipment Maintenance
- Improved Material Quality
- Enhanced Measurement Accuracy
- Optimized Environment
Result
- Reduction in Defective Products: The defect rate dropped within three months.
- Increased Customer Satisfaction: Customer complaints and returns significantly decreased
- Cost Savings: The company saved costs
- Employee Morale: Employees reported higher job satisfaction due to better training and improved working conditions.
Conclusions
By using the Fishbone Diagram, the company systematically identified and addressed the root causes of the defects, leading to substantial improvements in product quality and overall operational efficiency
Importance of social media in business branding